Analysis
Methodology
Simulation Setup
- Simulation Duration: 100 time steps.
- Scenarios:
- Movistar (
 ): Two-Tier architecture (Edge + Centralized).
 - Vodafone (): Two-Tier architecture (Edge + Centralized).
- Orange (): Two-Tier architecture (Edge + Centralized).
- Verizon (
 ): Two-Tier architecture (Edge + Centralized).
 - AT&T (): Two-Tier architecture (Edge + Centralized).
- T-Mobile (): Two-Tier architecture (Edge + Centralized).
- US Cellular (): Two-Tier architecture (Edge + Centralized).
- Movistar (
A note on how memory is calculated
Memory is calculated based on the number of entries and the size of the data structures.
- Entry Size: We use a consistent 12 bytes per entry for both architectures to ensure a fair comparison.
- 5G: Derived from a 24-byte
ForwardingState5Gstruct containing both Uplink and Downlink tunnels information (2 entries). - 6G-RUPA: Derived from a 12-byte
ForwardingEntry6GRUPAstruct.
- 5G: Derived from a 24-byte
- Scaling:
- 5G: The number of entries is scaled by the
scale_factor(1000 users per agent), as 5G maintains per-session state (\(O(n)\)). - 6G-RUPA: The number of entries is determined by the network topology and does not scale with the number of users (\(O(1)\) complexity).
- 5G: The number of entries is scaled by the
Results by Country
The reduction factors are even more extreme here than in the single-tier scenario because the Centralized UPFs in 5G must maintain state for all sessions in their region, whereas in 6G-RUPA, the core routers only need to know the topology of the core network, which is very small (19-24 nodes).
Tier 1 (Edge)
| Configuration | Total 5G Mem (MB) | Total 6G-RUPA Mem (MB) | Reduction Factor | Max 5G Entries | Max 6G Entries |
|---|---|---|---|---|---|
| Movistar_Spain_Tier1 | 1392.79 | 0.83 | 1,682.2x | 19,096,000 | 7,412 |
| Orange_Spain_Tier1 | 1390.09 | 0.66 | 2,098.8x | 20,338,000 | 2,905 |
| Vodafone_Spain_Tier1 | 1390.14 | 0.44 | 3,129.7x | 14,824,000 | 1,126 |
Tier 2 (Centralized)
| Configuration | Total 5G Mem (MB) | Total 6G-RUPA Mem (MB) | Reduction Factor | Max 5G Entries | Max 6G Entries |
|---|---|---|---|---|---|
| Movistar_Spain_Tier2 | 1392.79 | 0.0018 | 781,824.4x | 46,526,000 | 19 |
| Orange_Spain_Tier2 | 1390.09 | 0.0022 | 643,823.3x | 45,780,000 | 17 |
| Vodafone_Spain_Tier2 | 1390.14 | 0.0025 | 547,994.0x | 34,140,000 | 13 |
Tier 1 (Edge)
| Configuration | Total 5G Mem (MB) | Total 6G-RUPA Mem (MB) | Reduction Factor | Max 5G Entries | Max 6G Entries |
|---|---|---|---|---|---|
| Att_USA_Tier1 | 9429.20 | 2.73 | 3,452.1x | 48,270,000 | 12,522 |
| Tmobile_USA_Tier1 | 9426.11 | 4.82 | 1,954.9x | 49,996,000 | 24,387 |
| Uscellular_USA_Tier1 | 9432.98 | 0.07 | 135,303.0x | 98,692,000 | 146 |
| Verizon_USA_Tier1 | 9431.10 | 2.10 | 4,490.4x | 41,606,000 | 7,783 |
Tier 2 (Centralized)
| Configuration | Total 5G Mem (MB) | Total 6G-RUPA Mem (MB) | Reduction Factor | Max 5G Entries | Max 6G Entries |
|---|---|---|---|---|---|
| Att_USA_Tier2 | 9429.20 | 0.0025 | 3,717,004.5x | 198,988,000 | 22 |
| Tmobile_USA_Tier2 | 9426.11 | 0.0025 | 3,715,786.5x | 269,568,000 | 25 |
| Uscellular_USA_Tier2 | 9432.98 | 0.0025 | 3,718,493.2x | 365,244,000 | 30 |
| Verizon_USA_Tier2 | 9431.10 | 0.0025 | 3,717,753.4x | 196,364,000 | 24 |
Global Statistics
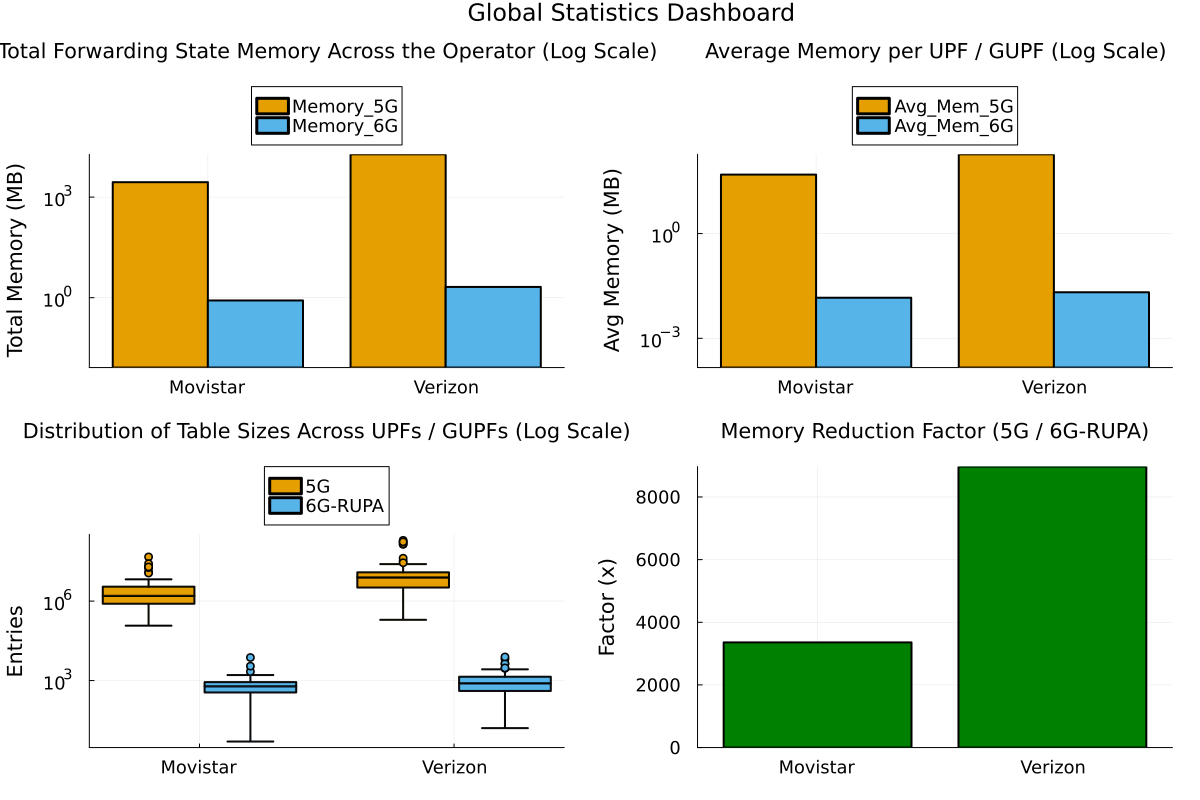
Understanding the Distribution
The box plot (bottom-left in the dashboard) illustrates the distribution of forwarding table sizes (number of entries) for every UPF (in 5G) and GUPF (in 6G-RUPA) in the simulation.
The plot shows:
- Y-Axis (Log Scale): The number of entries is plotted on a logarithmic scale to accommodate the massive difference between architectures.
- The Box: Shows the middle 50% of the UPFs. The horizontal line inside is the median size.
- Whiskers & Outliers: The whiskers show the range of typical values, while individual points represent outliers—UPFs with exceptionally high or low loads.
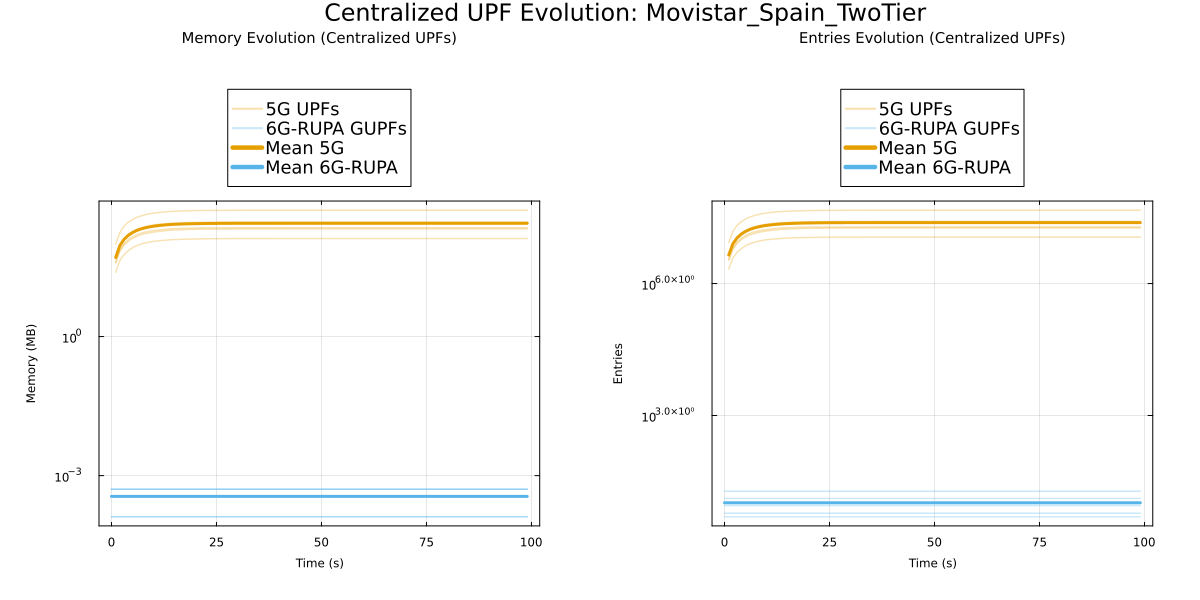
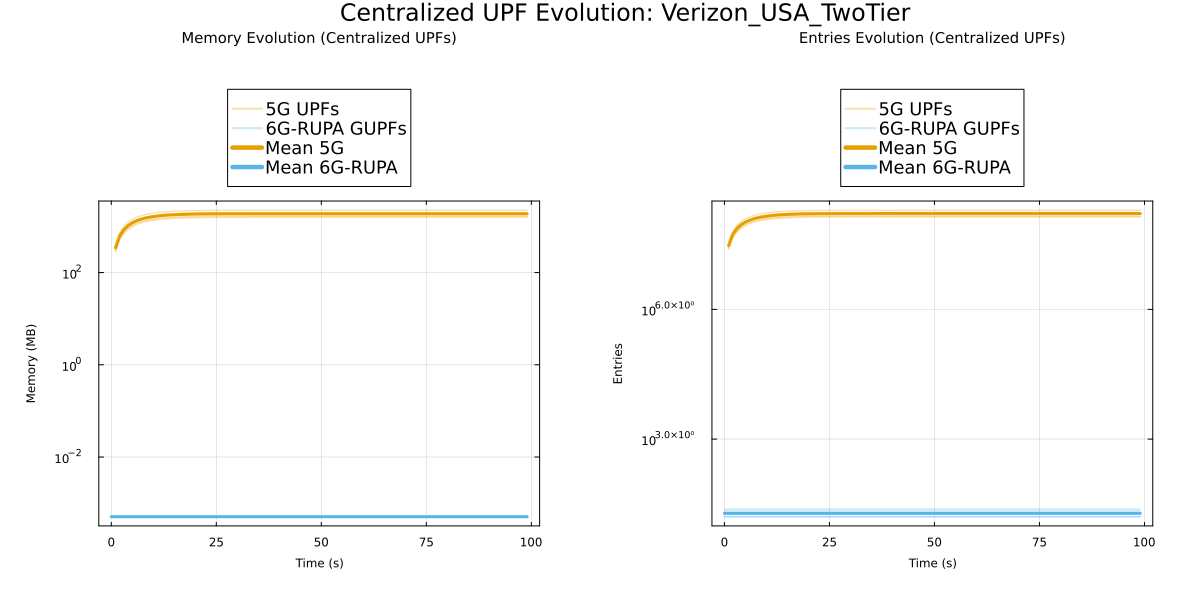
Detailed Evolution Analysis
A note on the plots
- Logarithmic Scale: The plots use a logarithmic scale on the Y-axis. Since \(\log(0)\) is undefined, the 5G (Orange) line starts at the first time step where sessions are established (Time 1.0), appearing to "jump" from 0.
- 6G-RUPA (Blue): This line starts at Time 0 with a non-zero value because the routers are pre-populated with the network topology.
A note on how memory is calculated
Memory is calculated based on the number of entries and the size of the data structures.
- Entry Size: We use a consistent 12 bytes per entry for both architectures to ensure a fair comparison.
- 5G: Derived from a 24-byte
ForwardingState5Gstruct containing both Uplink and Downlink tunnels information (2 entries). - 6G-RUPA: Derived from a 12-byte
ForwardingEntry6GRUPAstruct.
- 5G: Derived from a 24-byte
- Scaling:
- 5G: The number of entries is scaled by the
scale_factor(1000 users per agent), as 5G maintains per-session state (\(O(n)\)). - 6G-RUPA: The number of entries is determined by the network topology and does not scale with the number of users (\(O(1)\) complexity).
- 5G: The number of entries is scaled by the
Movistar Spain
Verizon USA
Key Insights
No Bottleneck at the Centralized UPFs
In the Two-Tier architecture, the Centralized UPFs (Tier 2) act as massive aggregation points. In the 5G architecture, this creates a critical bottleneck because these nodes must maintain per-session state for millions of users across a vast region.
-
5G: A single Centralized UPF in the Verizon scenario reaches 196 million entries, requiring nearly 10 GB of high-speed memory. This is physically impossible to implement in current high-speed switching hardware (ASICs), forcing these functions into slower software-based implementations.
-
6G-RUPA: The corresponding GUPF in 6G-RUPA requires only 24 entries. This is because it only needs to know the topology of the network (the Tier 1 routers) to route traffic.
Complete Decoupling of State and Scale
The results demonstrate a complete decoupling of network scale (growth of number of UEs) from network state (forwarding state memory usage) in the core.
Memory Growth vs. User Scale
The following plots illustrate how memory usage in the Centralized UPF (Tier 2) evolves as the number of active sessions (users) increases.
Verizon USA (Large Scale)
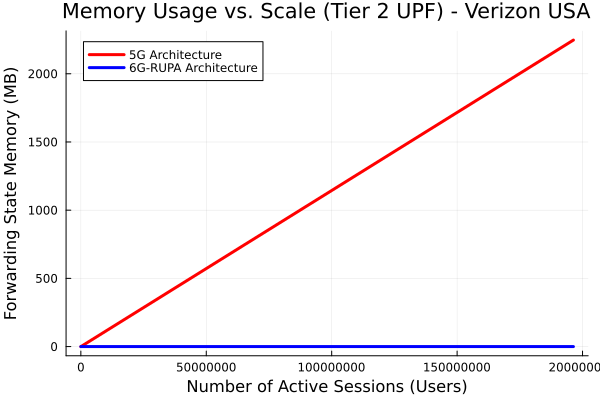
Movistar Spain (Medium Scale)
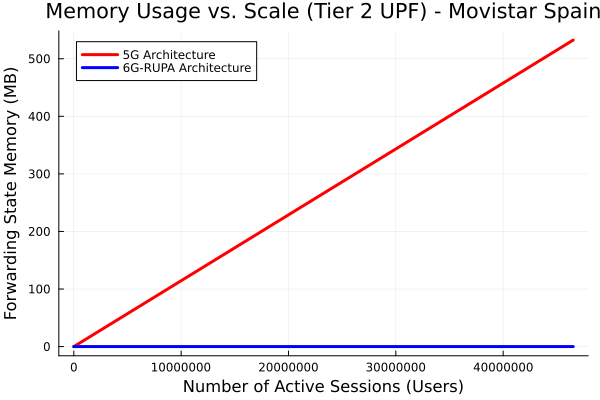
- 5G (Red Line): Shows a linear increase in memory usage as more users connect. The memory footprint grows indefinitely with the number of sessions.
-
6G-RUPA (Blue Line): Remains perfectly flat. The memory usage is constant regardless of how many users are connected, as it only depends on the network topology.
-
Unlimited Scalability: You could add 100 million more users to the Verizon network, and the state in the 6G-RUPA Core GUPFs would remain exactly 24 entries.
-
Zero-Cost Core Expansion: Expanding the capacity of the network by adding more users has literally zero marginal cost in terms of memory footprint for the core routers.
Feasibility of All-Hardware Core
The difference between 196,000,000 entries and 24 entries is a reduction factor of over 3.7 million. That means that in 6G-RUPA you can fit the entire forwarding table for a core router into a few bytes of register memory. This allows the core network to be built using ultra-fast, simple, and energy-efficient programmable switches (like P4 switches) without external memory, operating at terabits per second with deterministic latency.