Analysis
Methodology
Simulation Setup
- Simulation Duration: 100 time steps.
- User Lifecycle: Users connect around time step 5 and disconnect around time step 95. (typical eMBB scenario)
- Scenarios:
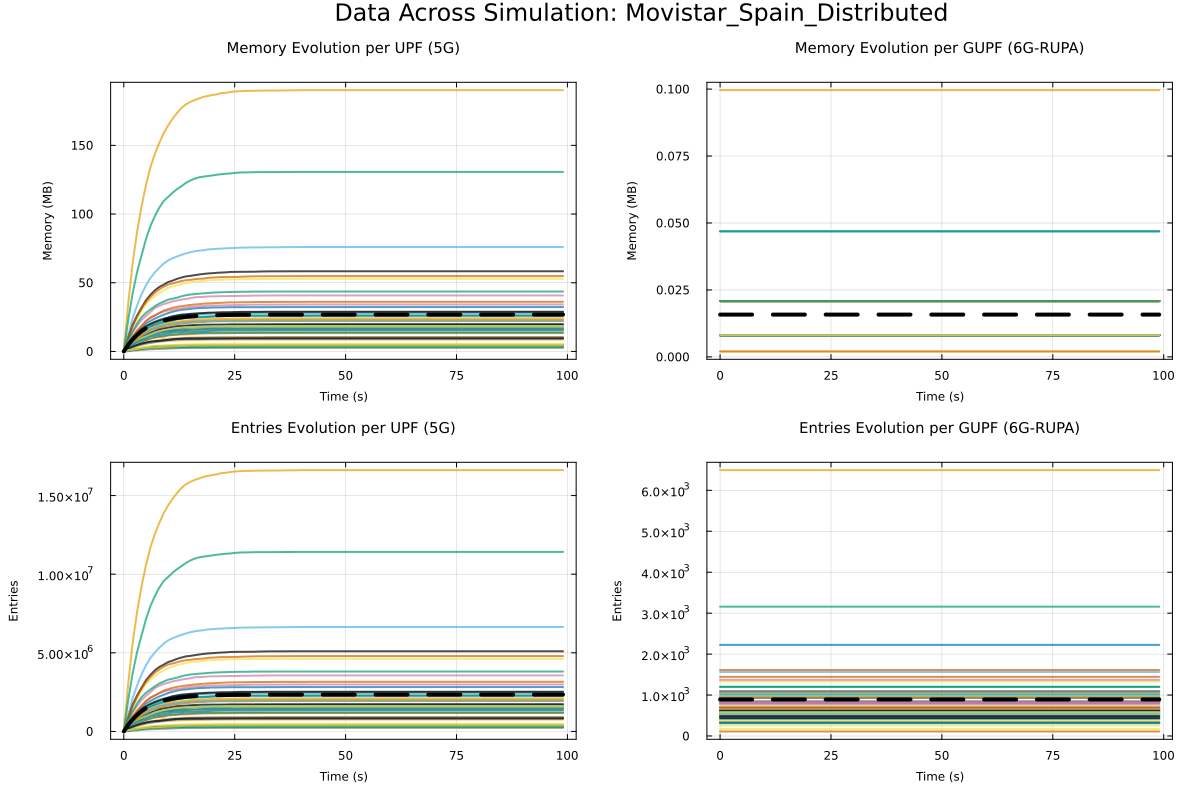
- Movistar (Spain): Smaller topology, moderate density.
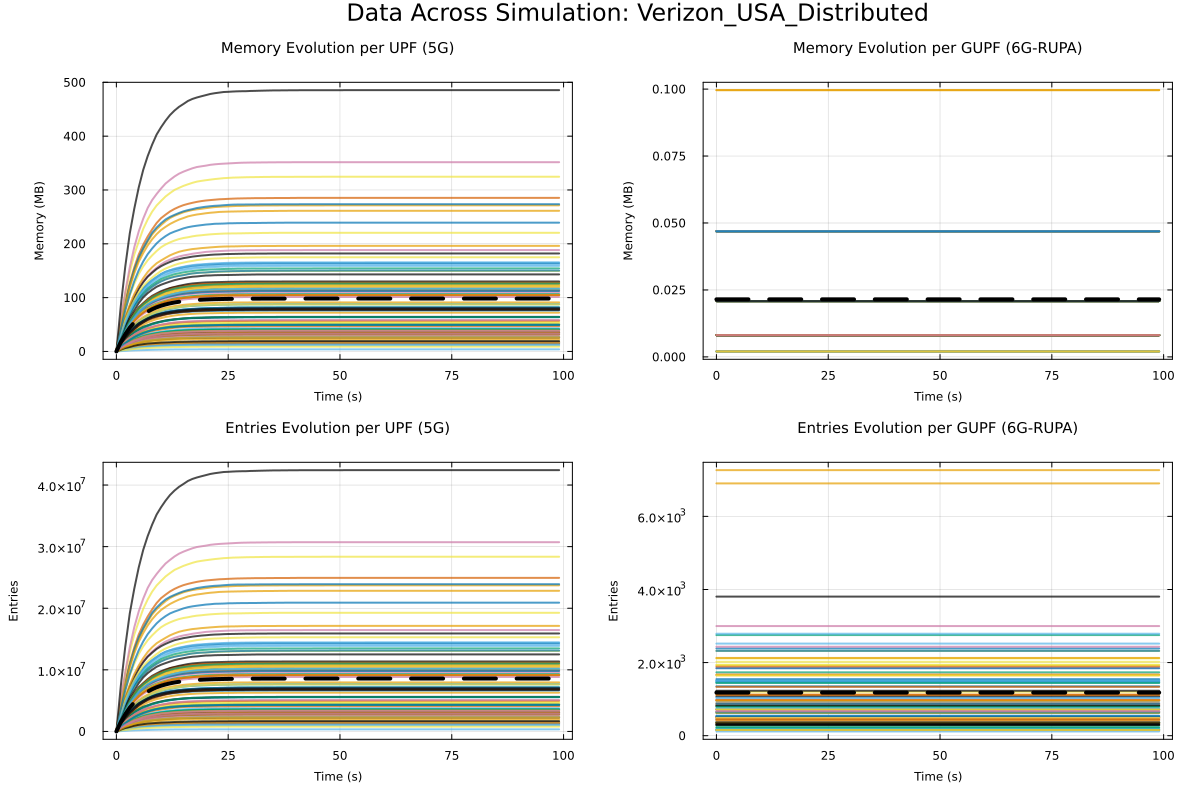
- Verizon (USA): Large topology, high density.
| Configuration | Total 5G Mem (MB) | Total 6G-RUPA Mem (MB) | Reduction Factor | Max 5G Entries | Max 6G Entries |
|---|---|---|---|---|---|
| Movistar_Spain | 1395.31 | 0.82 | 1698.9x | 16618000 | 6493 |
| Verizon_USA | 9434.78 | 2.06 | 4574.1x | 42424000 | 7265 |
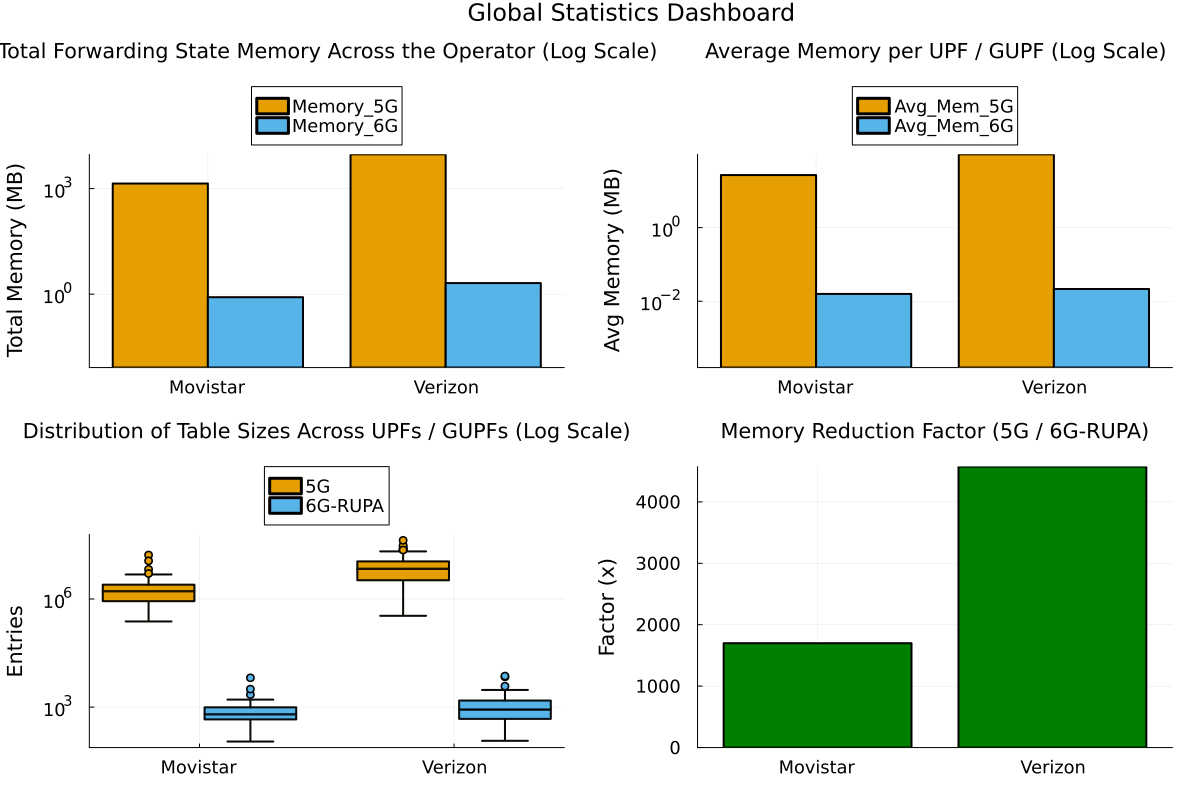
The main take here is that if we compare the total memory used by the 5G architecture versus the 6G-RUPA architecture, we can see a massive reduction in memory usage, with reduction factors of 1698.9x for Movistar Spain and 4574.1x for Verizon USA.
Let's break down the results further.
Global Statistics
Understanding the Distribution
The box plot (bottom-left in the dashboard) illustrates the distribution of forwarding table sizes (number of entries) for every UPF (in 5G) and GUPF (in 6G-RUPA) in the simulation.
The plot shows:
- Y-Axis (Log Scale): The number of entries is plotted on a logarithmic scale to accommodate the massive difference between architectures.
- The Box: Shows the middle 50% of the UPFs. The horizontal line inside is the median size.
- Whiskers & Outliers: The whiskers show the range of typical values, while individual points represent outliers—UPFs with exceptionally high or low loads.
So the separation between the two groups is essentially three orders of magnitude. This means that even the largest GUPF in 6G-RUPA has a forwarding table size that is about 1000 times smaller than the smallest UPF in 5G.
Simulation Evolution Analysis
A note on how memory is calculated
Memory is calculated based on the number of entries and the size of the data structures.
- Entry Size: We use a consistent 12 bytes per entry for both architectures to ensure a fair comparison.
- 5G: Derived from a 24-byte
ForwardingState5Gstruct containing both Uplink and Downlink tunnels information (2 entries). - 6G-RUPA: Derived from a 12-byte
ForwardingEntry6GRUPAstruct.
- 5G: Derived from a 24-byte
- Scaling:
- 5G: The number of entries is scaled by the
scale_factor(1000 users per agent), as 5G maintains per-session state (\(O(n)\)). - 6G-RUPA: The number of entries is determined by the network topology and does not scale with the number of users (\(O(1)\) complexity).
- 5G: The number of entries is scaled by the
Movistar Spain
Verizon USA
Some Insights
Hardware Acceleration Becomes Impossible
The difference between 9.4 GB (5G) and 2 MB (6G-RUPA) is of three orders of magnitude. In software (x86, COTS servers), 9 GB is somehow manageable. But in high-speed networking hardware (ASICs, P4 switches, Routers), memory is scarce and expensive. So essentially 5G UPFs cannot essentially run in hardware at scale. On the other hand, 6G-RUPA would fit entirely inside of a L2 cache of a standard CPU or hte on-chip SRAM of a commodity switch.
s6G-RUPA enables wire-speed forwarding that is physically impossible with the 5G architecture at this scale.
Zero-Marginal Cost of Users
6G-RUPA exhibits \(O(1)\) state complexity with respect to user count. That basically means that adding the 10-millionth user to the 6G network costs zero additional forwarding memory. 5G has \(O(N)\) state complexity, which essentially means that adding them to 5G costs the same as the first user
Lookup speed (which translate to latency)
Memory size correlates directly with lookup speed, which in turn has to do with latency. The router has to find one specific ID among 42 million entries (the "biggest" UPF at Verizon) whereas in 6G-RUPA the lookup is among 7 thousand entries for the exact GUPF.
Not only that, but 5G by definition, needs to look up for an exact match algorithm. On the contrary 6G-RUPA will do the lookup using topological prefix match which is some sort of longest prefix match.